How to Read 13F Filings (And What They Actually Tell You)
Most 13F analysis stops at 'Buffett bought Apple.' Here's how to actually extract signal from institutional filings — using the same framework I built to track 45 of the world's best investors.

Every quarter, roughly 45 days after period-end, thousands of institutional investors file a document with the SEC called a 13F. It's a snapshot of their long equity holdings — what they own, how many shares, and the market value.
And every quarter, the financial media reduces it to the same headline: "Buffett bought X. Ackman sold Y."
That's not analysis. That's gossip.
I've spent the better part of a year building a system that tracks 13F filings from 45 of the best fundamental investors in the world — funds like Baupost, Pershing Square, Lone Pine, Appaloosa, Himalaya Capital, and Oaktree. Not to chase their picks, but to understand where conviction is clustering and capital is flowing.
Here's what I've learned about how to actually read these filings.
What a 13F Filing Actually Is
A 13F-HR is a quarterly SEC filing required of institutional investment managers with at least $100 million in qualifying assets. It reports long positions in US-listed equities and certain other securities (options, convertible notes, etc.).
A few things to understand upfront:
- It's backward-looking. A filing for Q4 2025 (positions as of December 31) isn't due until February 14, 2026. By the time you're reading it, the fund may have already changed its position. This 45-day lag is the single most important thing to internalize.
- It only shows long equity positions. You won't see short positions, fixed income, private holdings, derivatives (mostly), or cash. You're seeing a partial picture.
- It reports market value, not cost basis. You can see what a position is worth, but not what they paid for it or when they started buying.
None of this makes 13Fs useless. It just means you need to know what to look for.
Mistake #1: Focusing on Individual Buys
This is the most common error. A headline says "Baupost opened a new position in Amazon" and people rush to buy AMZN. But context matters enormously.
In our Q4 2025 analysis, Baupost's new Amazon position was roughly $490K — representing just 9.3% of their portfolio. For a fund of Baupost's size, that's a meaningful allocation. But if it had been 0.1% of their portfolio? That's a rounding error. Maybe it's a hedge, a basket trade, or an analyst's exploration position.
What actually matters: the position size relative to the fund's total AUM (assets under management) and the number of holdings they run. A $50 million fund putting 15% into a single stock is making a statement. A $20 billion fund putting 0.03% into that same stock is barely whispering.
What to Actually Look For
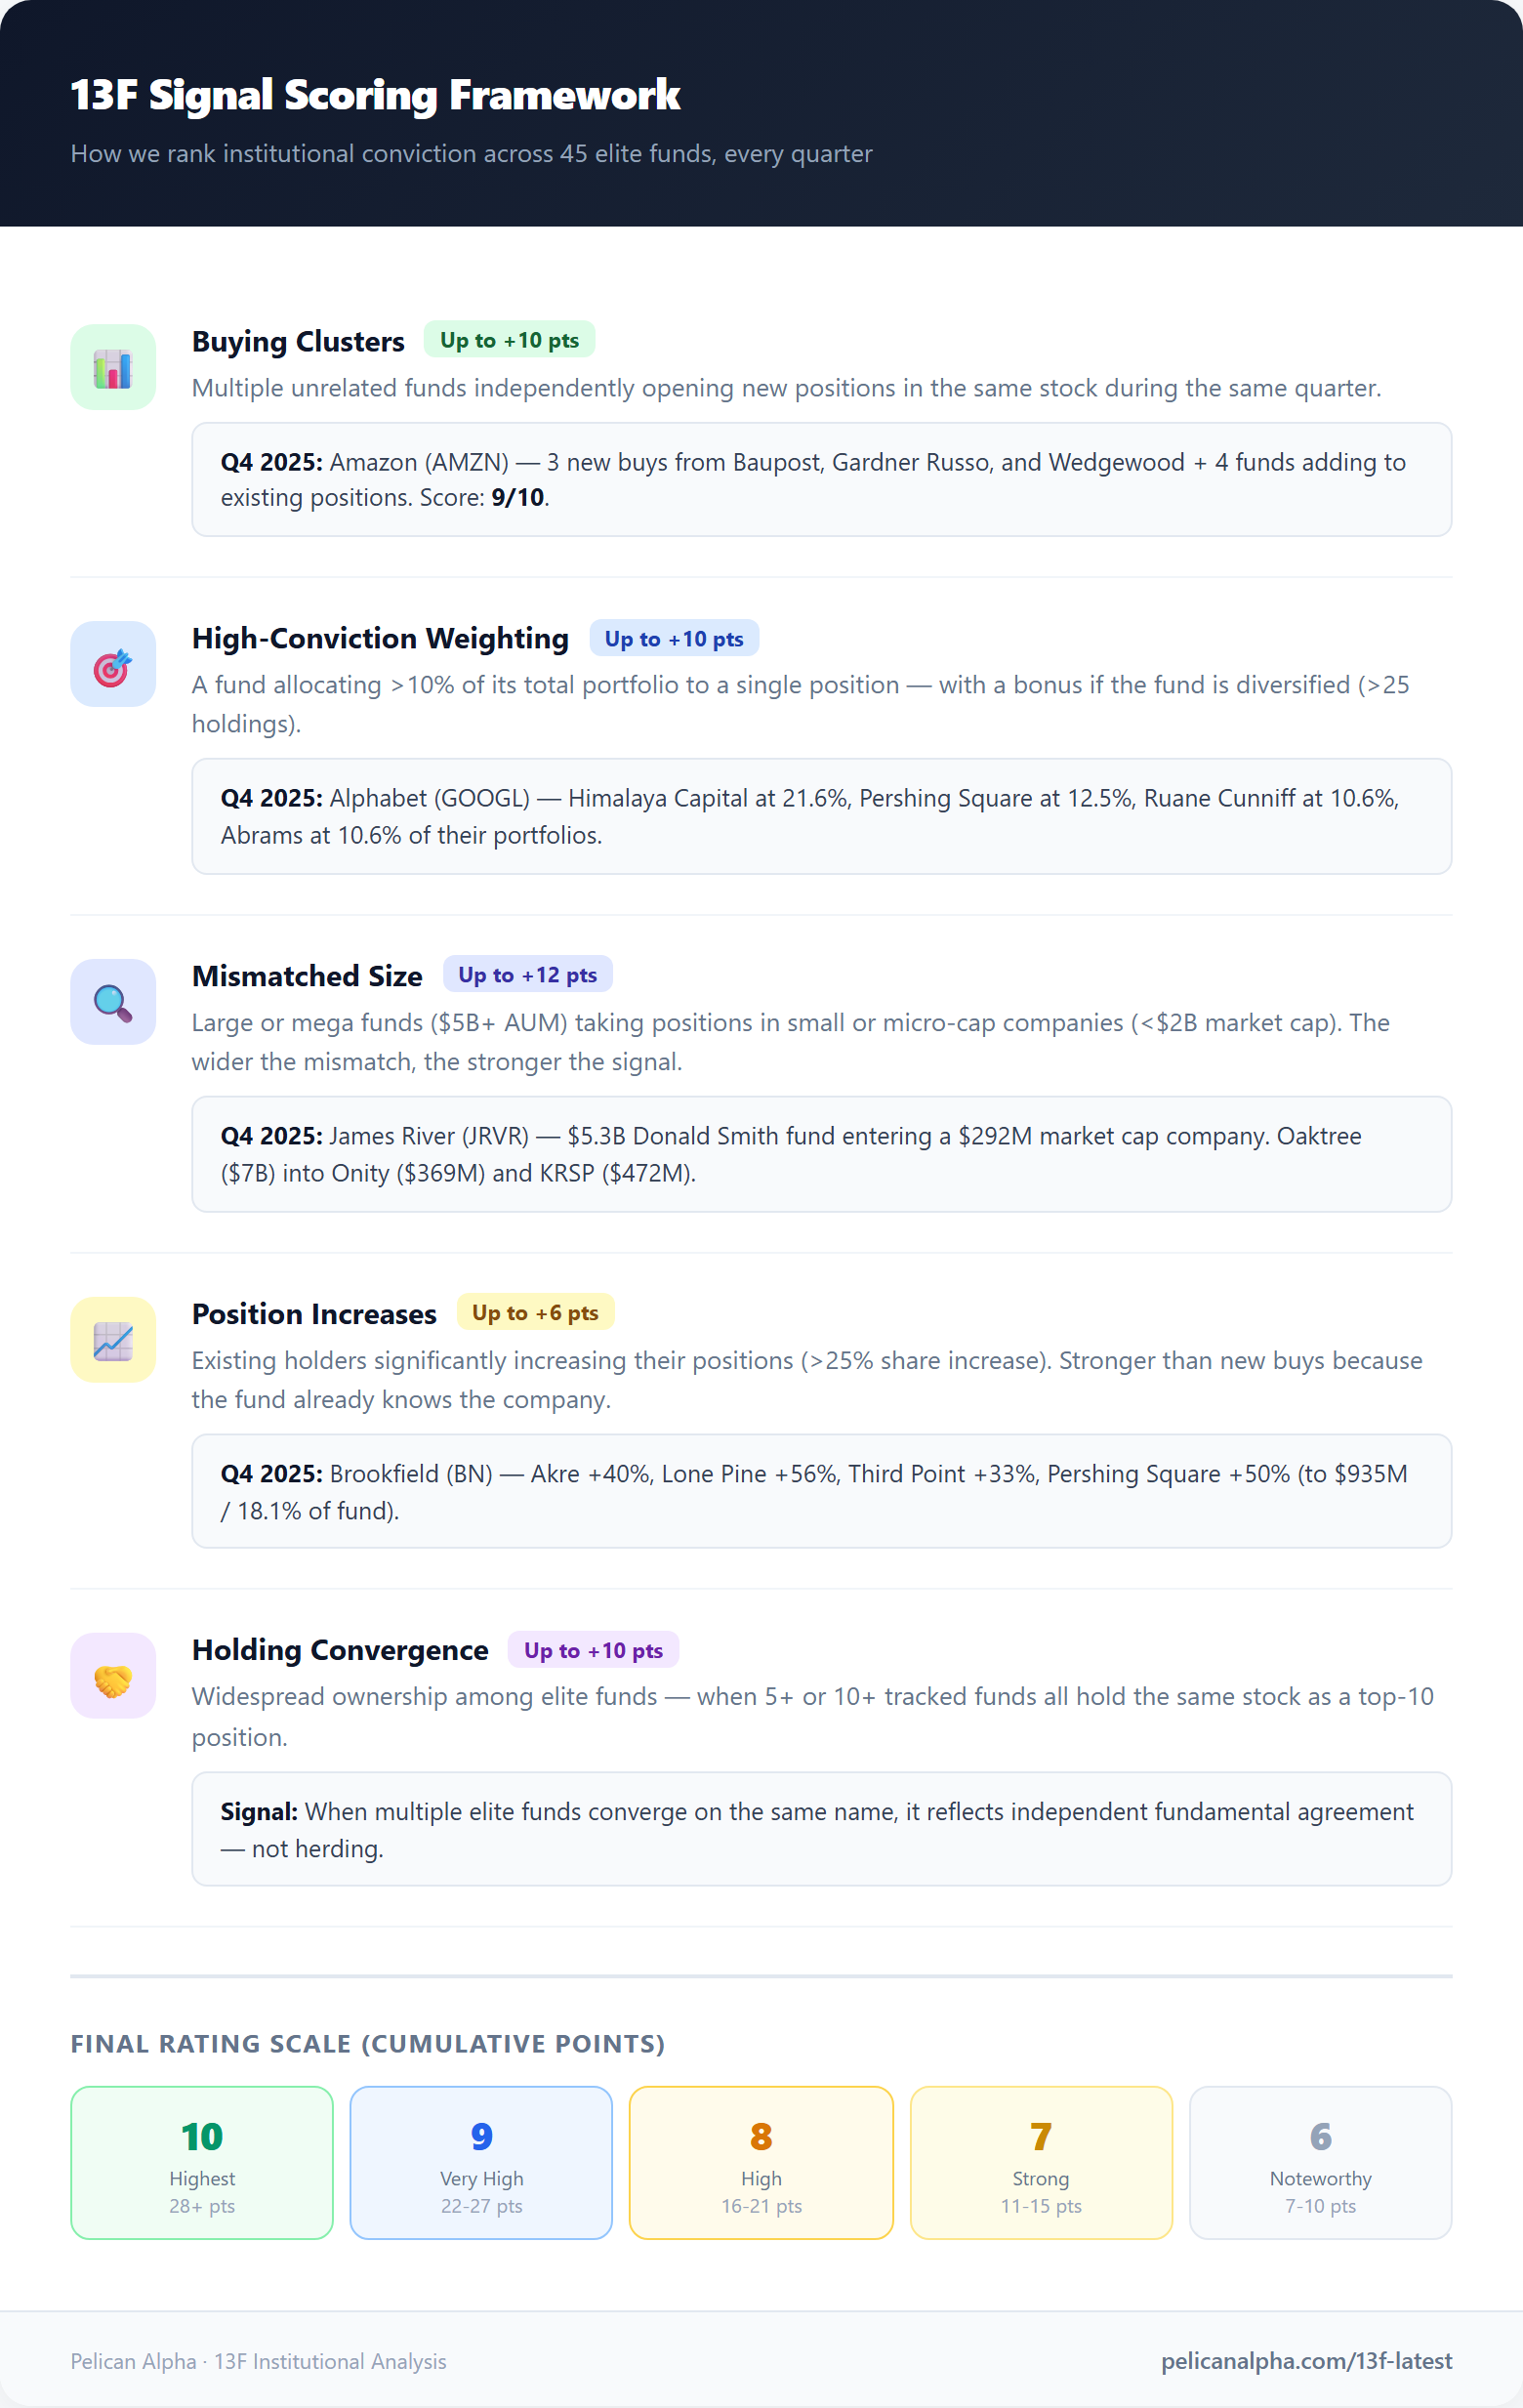
After processing hundreds of 13F filings, I've found five patterns that consistently produce actionable signal. These aren't theoretical — they're the exact scoring framework I use.
1. Buying Clusters
A single fund opening a new position tells you something. Three or four unrelated funds independently opening new positions in the same stock during the same quarter tells you something much louder.
These are buying clusters — multiple funds arriving at the same idea independently. They didn't coordinate (that would be illegal). They each did their own work and reached the same conclusion at roughly the same time.
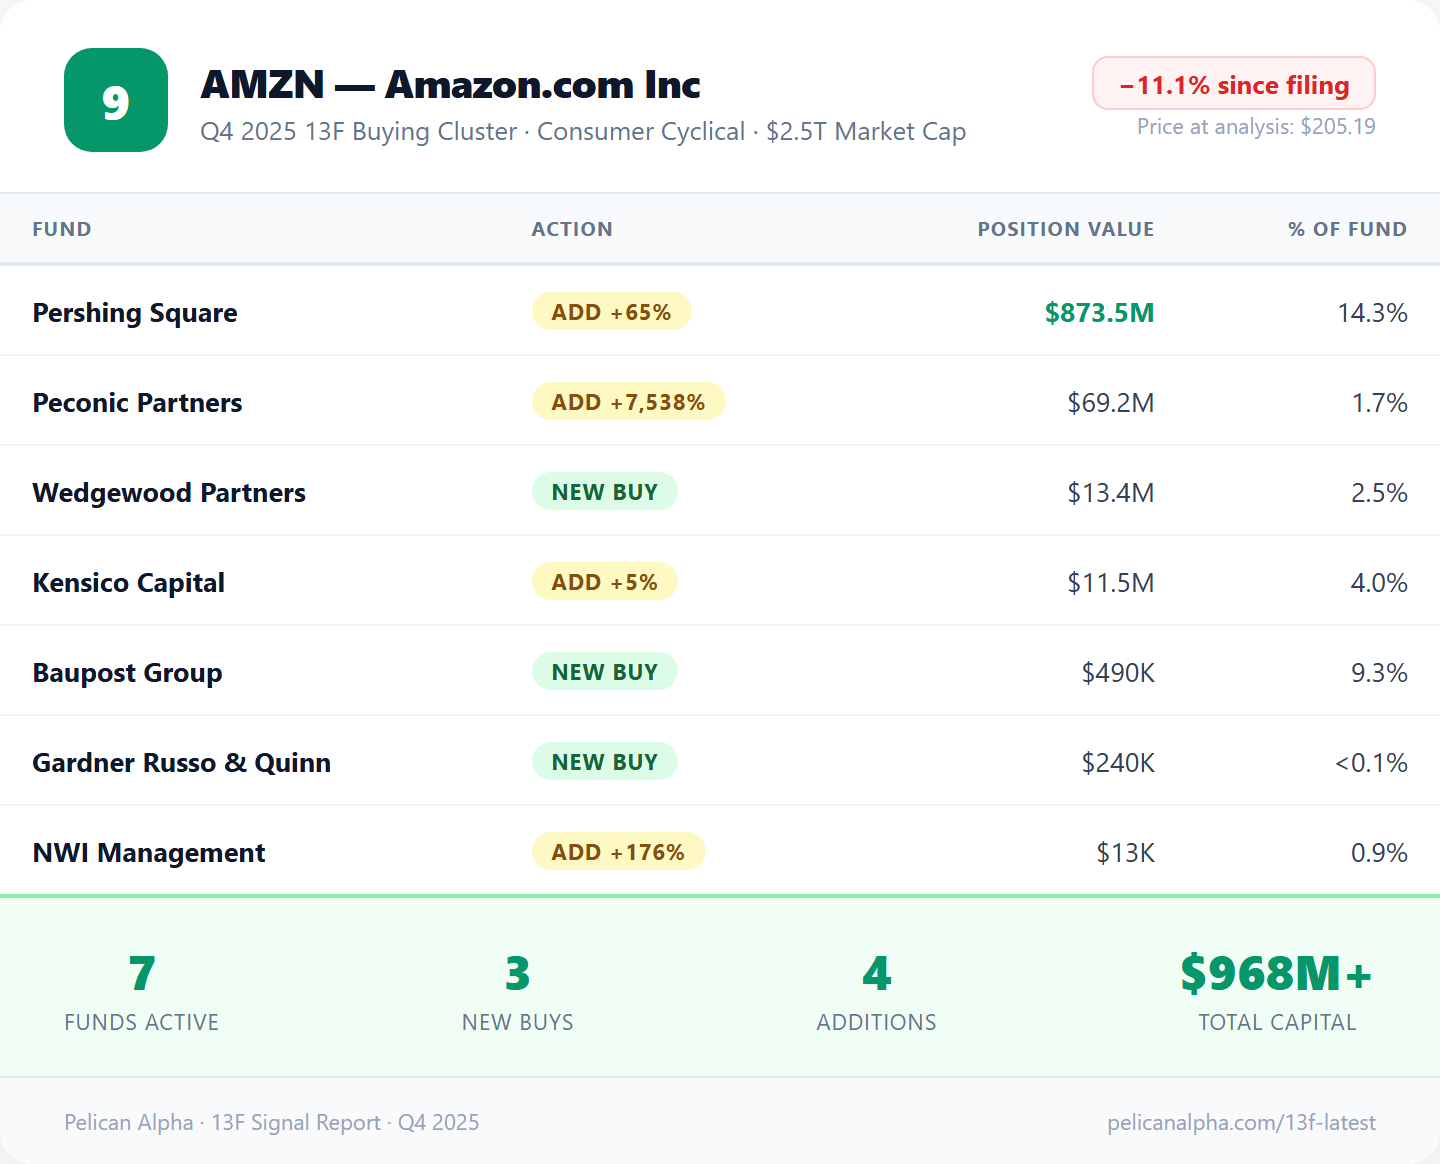
In Q4 2025, Amazon scored a 9 out of 10 on our system. Not because Baupost bought it — but because three separate funds initiated new positions (Baupost, Gardner Russo & Quinn, and Wedgewood Partners) while four more added to existing positions (Pershing Square increased by 65%, Peconic Partners by over 7,500%, Kensico by 5%, and NWI Management by 176%).
Seven funds. All moving the same direction. That's a cluster.
2. High-Conviction Weighting
When a fund makes a stock one of its largest positions — say, over 10% of its total portfolio — it's expressing serious conviction. These managers live and die by their performance. They're not putting 15-20% of their fund into something they're lukewarm about.
In the same Q4 report, Himalaya Capital held Alphabet (GOOGL) at 21.6% of their portfolio. Pershing Square had it at 12.5%. Ruane Cunniff (the Sequoia Fund team) and Abrams Capital both held it at 10.6%.
Four different high-caliber funds, all with 10%+ weights in the same stock. That's convergence.
3. The "Mismatched Size" Signal
This is my favorite and the one that most 13F analysis completely misses.
When a large fund ($5-20 billion AUM) or a mega fund ($20+ billion) takes a position in a small-cap ($500M-$2B) or micro-cap (under $500M) company, pay attention. These funds have analysts, compliance teams, and investment committees. They don't accidentally buy a $300 million market cap company.
The signal is even stronger when the fund's AUM dwarfs the company's market cap. A $7 billion fund buying into a $292 million company (like Donald Smith's new position in James River Group Holdings) means that fund had to actively choose to fish in a very small pond. The due diligence bar for that decision is extremely high.
Our scoring system gives extra points for these mismatched-size signals — and adds a kicker for companies under $100 million in market cap, where the asymmetry is most extreme.
4. Position Increases (Not Just New Buys)
New positions get all the attention. But a fund that already owns a stock and increases its position by 40-65% is often a stronger signal than a brand-new purchase.
Why? Because they already know the company. They've done the work. They've sat through earnings calls, talked to management, and watched the thesis play out. And after all that, they want more.
In Q4 2025, Brookfield Corp (BN) was a great example. Akre Capital increased its position by 40% (to 13.5% of its portfolio). Lone Pine added 56%. Third Point added 33%. Pershing Square added 50%, bringing its position to $935 million — 18.1% of its entire fund. Four separate funds increasing the same position in the same quarter.
5. "Conviction Holds"
Not every signal involves buying. Sometimes the most telling data point is what funds didn't sell.
When a stock declines and a fund holds its position unchanged — especially when that position is 10%+ of their portfolio — that's information. They had every reason and opportunity to trim, and they chose not to. In a world where most portfolio managers are incentivized to cut losers and window-dress their reports, the decision to hold through drawdowns reveals conviction.
Our Q4 report flagged five "conviction holds" — positions where elite funds maintained large allocations despite meaningful price declines since the prior quarter's filing.
The 45-Day Lag: Feature, Not Bug
Everyone complains about the delay. "By the time you read the 13F, the trade is old news." This is true — and it doesn't matter as much as you think.
Here's why: the investors I track aren't day traders. Baupost, Pershing Square, and Himalaya Capital hold positions for years. A new position initiated in Q4 2025 isn't a trade that'll be gone by Q1 2026. It's the beginning of a thesis that often takes 12-24 months to play out.
The 45-day lag matters for momentum traders. It barely matters for fundamental investors following other fundamental investors.
What I actually do with the lag: I compare the stock's price at quarter-end (when the filing reflects their holdings) to the current price. If a fund opened a new position at $20 and the stock is now at $17, the setup might be better than when they bought it. The thesis doesn't change — but you're getting a lower entry point than the fund manager did.
In our Q4 2025 report, Amazon had drifted -11.1% from its filing-date price. FICO was down -19.1%. S&P Global was down -19.7%. If the thesis that attracted multiple elite funds was valid at higher prices, a double-digit decline doesn't invalidate it — it amplifies the opportunity.
How I Built This Into a System
Reading one 13F filing is straightforward. Reading 45 of them every quarter, cross-referencing the holdings, identifying clusters, weighting by conviction, and flagging size mismatches — that's a different problem entirely.
I built a pipeline that does this programmatically:
- Download and parse every 13F-HR filing for 45 tracked funds directly from SEC EDGAR
- Aggregate by security — for each stock, map out every fund that holds it, every new buy, every addition, and every conviction hold
- Score each position across five dimensions: holding convergence, buying convergence, high-weighting conviction, position increases, and mismatched-size signals
- Rank by total score on a 1-10 scale and generate a signal report with the full detail behind each rating
The result is a quarterly report like our Q4 2025 13F Institutional Flows analysis — not a list of "what Buffett bought," but a systematic map of where the smartest money is clustering.
The Bottom Line
13F filings are one of the few free, reliable sources of institutional investment data available to individual investors. But most people extract maybe 5% of the available signal because they stop at the headline.
The real value isn't in any single fund's single purchase. It's in the patterns across funds: where conviction is clustering, where large funds are entering small companies, where existing holders are doubling down, and where everyone is holding through volatility.
That's what I track. That's what our 13F signal reports are built to surface.
If you want to dig into the raw data yourself, start with the SEC's EDGAR full-text search for 13F-HR filings. Or check our methodology page for a deeper look at how the scoring system works.
Either way — read the actual filings. The signal is there. You just have to know where to look.
This analysis is for educational purposes only and does not constitute investment advice. The author may hold positions in securities discussed. Always do your own due diligence before making investment decisions.
Get Daily Signals in Your Inbox
Join investors who start every morning with Pelican's top ideas.
Subscribe Free